
Bandaged Cube Explorer
tl;dr, I made a program for exploring bandaged configurations of the 3x3x3 Rubik’s cube. You can play with it here. If you are interested in the source code, it’s available on my github. Read on to learn about what it does and how it works or skip to the bottom for some links to nice examples.
Bandaged Cubes
I recently came across this video about how to think about bandaged twisty puzzles. The video is not long and does a good job of introducing the premise of bandaging a puzzle so I’ll skip over explaining that here.
Before watching that video, I had been aware of the idea of bandaging and had even tried solving a few bandaged puzzles, but something hadn’t clicked for me. My experience was that simplest ones were too easy and didn’t present and new challenges; but that harder ones were too difficult to even formulate an approach. That video was exciting because the “loops in a graph” strategy seemed like it could be applied to many other bandaged configurations.
I was also delighted about the way the threefold symmetry of the puzzle got reflected into threefold symmetry in the graph. When I first tried to get into bandaged puzzles, I found a few docs online containing collections of named configurations like this doc, and this other doc. What they both lacked was guidance on what kind of experience to expect when solving each puzzle. The threefold symmetry of the puzzle and the graph gave me hope that a bandaged puzzle’s state graph might give a hint to what kind of solve to expect.
Playing with d3.js
Pretty early in my design process, I came across a github project where someone had already done exactly what I was imagining. Even better, the author included a csv of all distinct bandaging schemes and some metadata about each one. There were a few things I didn’t like about it though.
- It required the user to run python - meaning it was inaccessible to many potential users.
- I couldn’t get the cube drawings to work for me.
- Sometimes the graphs it generated were so tangled up that it was impossible to see what was going on.
I decided I would make my own version to address these points. First of all, my version would be a webapp so it could be used from more platforms. And second, my version would be interactive so the user could zoom and shift nodes around as needed.
The platform I chose was d3.js’s force directed layout. The idea is that each node is given a slight negative charge and each edge is given a slight spring force. The charge means that nodes spread out away from each other and the spring force means that connected nodes stay near each other. For many graphs, this sort of layout does a good job at both global and local layout. Best of all, d3.js supports a huge amount of customization and a huge number of features.
I decided to avoid labels on nodes or edges because I was worried they would make the graph unreadable as it grew. Instead I decided to color code my edges according to which face was was turned and to indicate direction with an arrowhead and to add mouseover previews for each node’s meaning. To deal with the varied size of state graphs, I used d3’s standard panning and zooming features. To deal with awkward graph layouts, I added interactive dragging so the user could untangle graphs manually.
Drawing self edges
One limitation I ran into with d3 was was drawing edges from nodes to themselves. By default, this drew a line whose start and end points were the same - a.k.a. nothing. I found a helpful answer on github how to turn these into arcs from the point to one very nearby. This worked well, and as a side benefit, I could modify my choice of nearby point to change the orientation of the loop.
One nice example of this is the graph for an unbandaged Rubik’s cube. On this cube, all 6 face loop back to the only state. As a solver, this sort of self edge is quite useful so I was happy to be able to show all 6 so distinctly.
On the way to finding that answer, I experimented with a different approach where I added a not-drawn node in the middle of each edge and used it to make edges curve. This turned out not to solve the self edge problem but I liked it so it got to stay.
Reverse Engineering the Spec
One problem I needed to solve before getting started was how users would input bandaged cube IDs. I decided to use the scheme devised by Andreas Nortman since it seemed to be the standard. The way it works is to define each bandaged cube by the presence or absence of 54 “bonds”. Each bond is given an offset in a 54-bit integer, usually represented in hexadecimal.
This representation is nice because it makes some operations very easy. For example, in order to test if a face can be turned, you only need to check if any of the 9 blocking bonds are present. Similarly, turning a face means doing a permutation of bits representing the bonds on that face. There was just one problem - I couldn’t find any documentation for which bonds corresponded to which offsets.
To make a long story short - I managed to reverse engineer the mapping by looking at the code of the github project mentioned above. I still don’t see the logic behind the mapping but I’m sure there is one. I made sure to document the mapping as much as possible in my code and with a helper image in the my project’s README.
There are a few things I don’t like about this about scheme. The first is that it is very unreadable for humans. This is probably unavoidable given that there are hundreds of thousands of possible signatures but it is still a shame. The second is that representations can be ambiguous. Imagine a cube where both the U and F centers are bonded to the UF edge. This makes the U and F faces permanently blocked - effectively bonding their centers to the core as well. I user might reasonable choose to write those core bonds or omit them. I think the csv on paul_cube_bandaged_graph has the right idea - it always always explicitly write the implied bonds. In the future, it might be nice to have a tool to “canonicalize” signatures so that it would be easy to tell when two people are talking about the same bandaged cube.
Drawing the cubes
The first thing I built was a way to preview what a given bandaged configuration looks like. Initially I wanted to draw this to the same svg as my nodes and edges but that turns out to be a problem once I added zooming. Rather than learn more about svg scaling in d3, I took a shortcut and put the preview on a second svg that is layered behind the main one. The one drawback is that a very busy graph will now obscure the legend a bit. I didn’t see that as a big problem since the user can just zoom out to create more whitespace.
Bit manipulation in javascript
As I mentioned above, the data format makes it pretty easy to check which faces can be turned and to compute the result of a turn using bit manipulation. The default number type in javascript aren’t integers so you can’t do bitwise math. Luckily, js now has a BigInt type which works approximately how I want. It supports common bitwise operations but it doesn’t guarantee O(1) for all them. It also doesn’t lend itself well to tools like my favorite tool for optimized bit swizzling.
I decided to do the responsible thing and ignore performance until it was problem. Even on the largest graphs, computing all necessary turns only takes a few seconds so I haven’t gone back to optimize this.
Building graphs from user input
Once I had all the groundwork in place, this part turned out quite easy. I do a breadth first search of the graph and keep track of all the nodes and edges that exist. When recording edges, I note which turn caused them to exist so I know which color to draw them.
In an earlier version, I planned to dedupe nodes that could be turned into each other by cube rotations or mirroring. My idea was that this could shrink the size of problematically large graphs. In the end I decided not to do this because rotations like this usually aren’t useful as a solver.
Future work
I’m relatively happy with this project. It does exactly what I set out to do, and the graphs are pretty satisfying to play with. If I ever come back to this, I have a few ideas I might implement to improve it further.
When zooming out, nodes become quite small and hard to click. It would be fun to size nodes based on the size of the graph so things continue to look good after zooming. To do this, I need to make sure my arrowheads don’t sink into the nodes that point at. My arrowhead code was copied from a stackoverflow answer so I’ll need to understand it to modify it.
Many graphs contain states that there’s no reason to visit. For an example, let’s take a look at the graph for the cube in the youtube video from the top of this post. The graph has some chains for 4-cycles that look almost like lace:
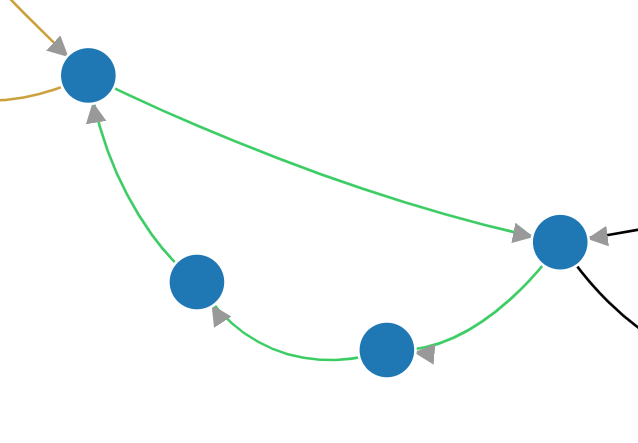
The reason for these 4-cycles is that turning a face four times returns it to its initial position. In the screenshot above, a solver progressing along that arc can either do one turn of the green face clockwise, or (equivalently) three turns counterclockwise. The states reached along the three counterclockwise turns are useless as a solver. There are also some features of the graph that looks like this:
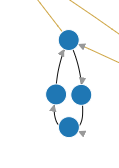
This 4-cycle represents a face that can be turned in one position, but such that turning that face block all other moves until the face is returned to its starting position. Once the cube has been returned to its original bandaged signature, there is no reason to visit these states.
I think it would be interesting to add a mode where extraneous nodes like these are removed. Doing this efficiently would be nontrivial but it might make some larger graphs lag less and be easier for a human to understand.
Nice examples
In the process of writing this post, I’ve looked at a few hundred graphs to see what they look like. Here are a few that I thought were especially interesting or pretty.
- 0x108400f7a00631 starts out a bit tangled and is satisfying to untangle.
- 0x80200084 has really interesting layers.
- 0x100400C7AC043D is very spread out
- 0x10000000000002 is impossibly tangled.
- 0x182800008 has nice 4-way symmetry
- 0xc63 looks like a face to me.
- 30000000040203 looks like 4 connected rings.
- 0x8000802005A0 takes a bit of prodding but I think it looks like the back of a fancy card.
If you come across any nice examples, please send me links. I’m always happy to look at a cool graph.
Using it to come up with solutions
In my next post, I’ll be writing about how I used this tool to help me come up with a solution to 0x20108000000C03. It is a puzzle where your options are tremendously limited and being able to visualize them clearly was key to coming up with a solution.
By coincidence, this puzzle has a graph-twin - 0x30000010048883 named “Bandaged Fortress” that others have solved. I’m excited to try that one as well and test my theory that the structure of the graph informs the experience of the solve.